Bollinger Bands show you overbought & oversold price levels for an instrument & this information is useful in detecting trends as they form.
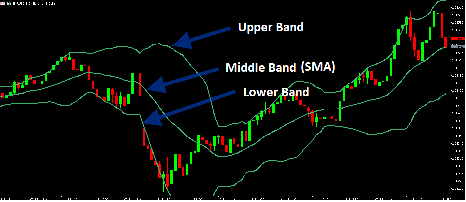
Bollinger Bands consist of an upper, middle, & lower band which are superimposed on your chart.
The Upper Band:
is automatically formed by setting the standard deviation to 2.0 so that 95% of the candles that form will be within the Upper Band.
The Middle Band:
is automatically formed by taking average prices of the instrument over a period which is 20 days by default (but you can change this)
The Lower Band:
is also formed by setting the standard deviation to 2.0 so that 95% of the candles that form will be within the Lower Band, hence better accuracy.
If you set the standard deviation below 2, some candles will fall outside the bands & if you set it above 2, only few candles will be able to touch the bands; so, you may not see any breakouts.
How to Trade with Bollinger Bands

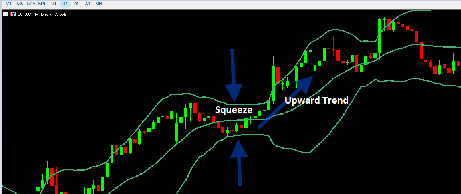
If the Bollinger Bands squeeze together in an upward trend, it indicates the market has slowed down & is about to rally (the calm before the storm). Hence you should prepare to execute a buy trade to benefit from the potential rise.
If the bands squeeze together in a downward trend, it also indicates the trend has slowed down & is about to surge further downward so you should prepare to execute a sell trade to benefit from the potential fall.
When the price touches or breaks past the upper band, it’s an indication that the instrument is overbought & the price could soon start falling. So you can open a sell trade to take advantage of the fall.
When the price touches or falls below the lower band, it is an indication that the instrument is oversold & its price could soon start rising. You can open a buy trade to take advantage of the rise.
The drawback of Bollinger Bands is that it depends on a Simple Moving Average so results may not be 100% accurate. You can use Bollinger Bands alongside other indicators such as Relative Strength Index (RSI) for further confirmation & comfort.
The drawback of Bollinger Bands is that it depends on a Simple Moving Average so results may not be 100% accurate.
You can use Bollinger Bands alongside other indicators such as Relative Strength Index (RSI) for further confirmation & comfort.

Leave a Reply