Hammer Candlestick Pattern
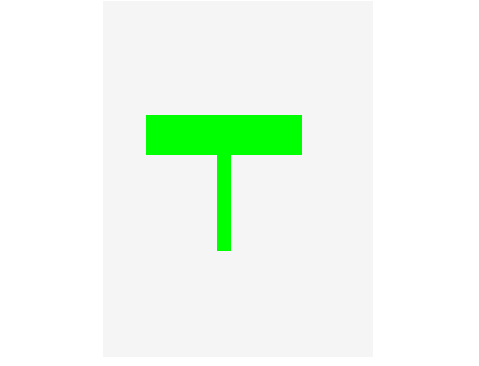
This is a single candlestick pattern that resembles a hammer and could be either red or green color.
For a candlestick to qualify as a hammer, the wick must be at least twice as long as the body & the head must have a small or no wick at all.
Green Hammer in a Downward Trend Signals Potential Reversal
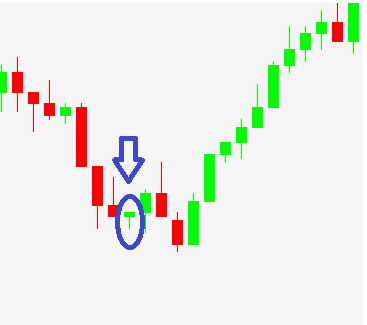
When you spot a green hammer candle during a downward trend, chances are the trend is dying out & an upward trend is in the horizon.
The long lower wick shows that after price opened, sellers pushed the price downwards but buyers countered the move and pushed price upward a longer distance, forcing it to close above its opening price.
The absence of an upper wick also shows that after buyers pushed price up, the sellers did not even react hence price closed above the opening without a serious fight.
Technically, the buyers did more work & moved price a greater distance than the sellers.
Red Hammer in an Upward Trend Signals Potential Reversal
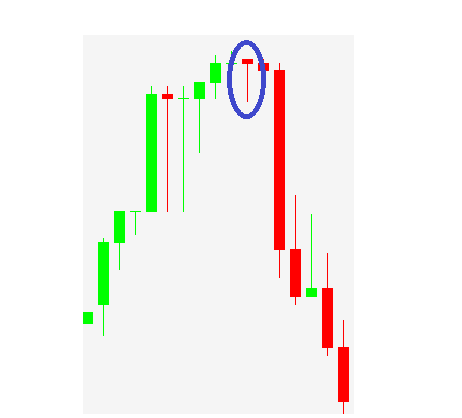
When you see a red hammer candlestick in an upward trend, it means a reversal could be around the corner.
This is because, the long lower wick shows the sellers pushed price down & then buyers countered by pushing price back up. Unfortunately, the buyers couldn’t make the price close higher than the opening price.
Also, the absence of a sizable upper wick shows that when price opened, the buyers didn’t really push price up a reasonable distance. It was only after sellers pushed price down, that the buyers reacted.
Technically, the sellers moved the price greater distance than the buyers.
Inverted Hammer Candlestick Pattern
Inverted hammer candlesticks can be any color and are characterized by a short body resembling a hammer head, & a long upper wick. Sometimes, they may have a tiny lower wick.
Red Inverted Hammer in an Upward Trend Signals Potential Reversal
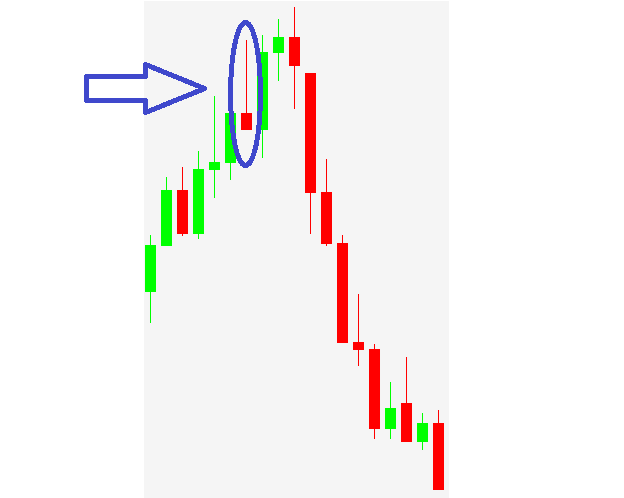
When you spot a bearish red inverted hammer(also known as a shooting star) in an upward trend, it means the trend may be dying out & a reversal is on the way.
Why? because the sellers have made price travel a longer distance than the buyers, indicating sellers are starting to take control.
The long upper wick & absence of a lower wick on the bearish hammer, shows sellers travelled a greater distance.
When price opened, buyers pushed it up but sellers resisted and pushed it down a greater distance, without any reaction from the sellers (hence no lower wick).
The sellers did more work in moving price a greater distance and forcing price to close below its opening point.
Green Inverted Hammer in a Downward Trend Signals Reversal
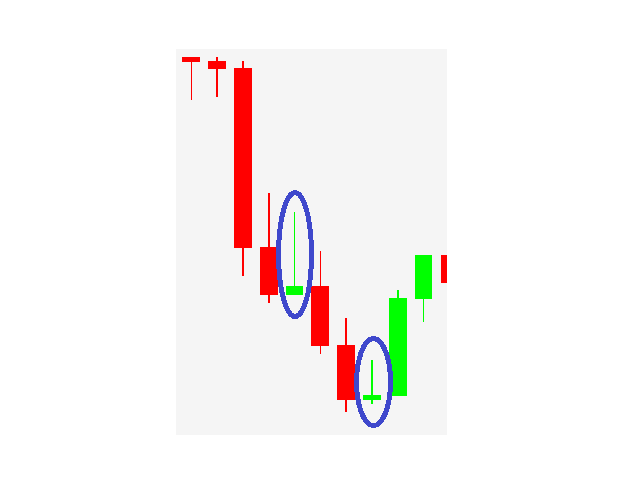
When you spot a green inverted hammer in a downtrend, it means a potential reversal to an uptrend may be around the corner.
The long upper wick (the handle of the hammer) shows after price opened, buyers pushed it really high, & sellers reacted by trying to push it down but ran out of gas too early. Because of this, the sellers couldn’t push the price low enough so it closes below its opening.
To cut he long story short, buyers made price travel a greater distance than the sellers did,
Doji Candlestick Pattern
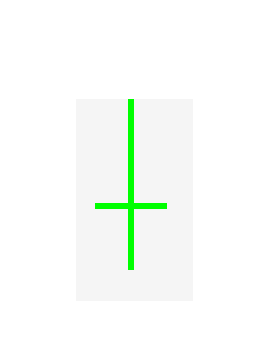
A Doji is a solo candlestick pattern that signifies a stalemate or indecision between buyers or sellers. The price is neither going up nor down.
The opening & closing prices in a Doji are almost the same so the body is thin but you see the upper & lower wicks.
If a Doji forms at the bottom of a downtrend, two things could happen:
- The downward trend could reverse into an upward trend
- The downward trend could continue
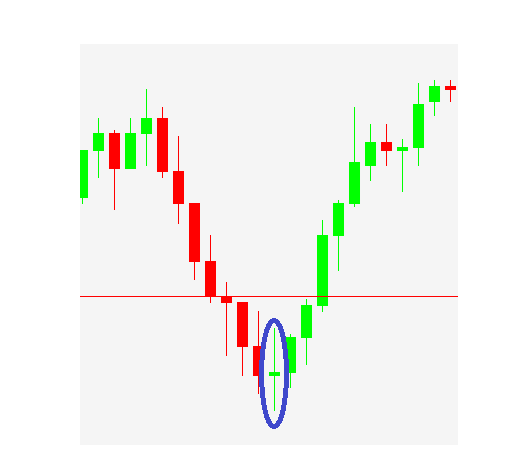
If a Doji forms at the top of an uptrend, two things could happen:
- The uptrend trend could reverse into a downtrend
- The uptrend could continue
When you see a Doji candlestick, you should be on alert and look for other sources of confirmation as per your next line of action.
One way of confirming what will happen after you see a Doji candle is to check previous support & resistance levels, to see if the Doji is sitting on an area of value.
Morning Star Candlestick Pattern
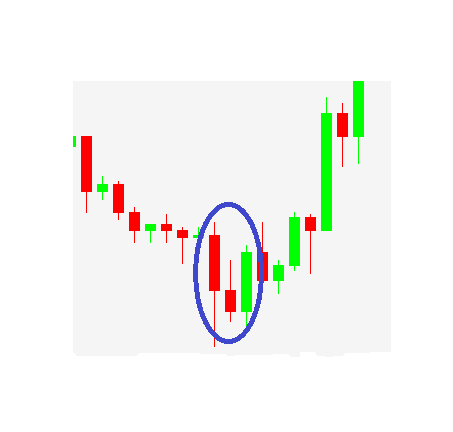
The morning star candlestick pattern is used to detect reversals from downward to upward trends as they happen.
A morning star candlestick pattern usually appears in a downtrend & when you see one, then a reversal to an uptrend may be nearby.
A morning star candlestick pattern is made up of 3 candles namely:
- Big red candle
- Doji or small candle(of any color)
- Big green candle (nearly the same size as the red candle)
Sone textbooks say the middle candle should be a Doji, but this is not always the case. There are times when the middle candle can be just a small candle, but its always a stronger signal if the middle candle is a Doji.
Evening Star Candlestick Pattern
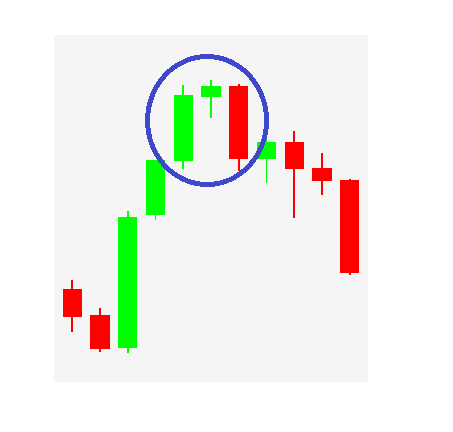
The evening star candlestick pattern is a triple candle pattern that appears in an upward trend & signals the trend is dying out.
When you spot an evening star candle pattern the chances are a trend reversal is about to start.
The evening star pattern consists of a big green candle, a very small candle(of any color), & a big red candle almost the size of the green one.
Bullish Engulfing Candlestick Pattern
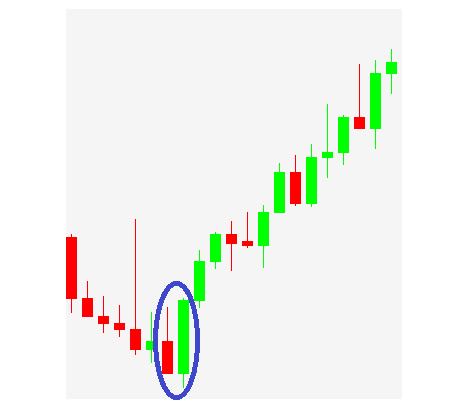
The Bullish engulfing pattern always appears in a downward trend, and signals that the downward trend is dying out & an upward trend may be on the way.
The Bullish engulfing pattern consists of a big red candle, followed by a big green one that completely engulfs it in size.

Leave a Reply