Head & Shoulders Pattern
The Head & Shoulders price pattern can form on any type of trading chart (Candlestick Chart, Line Chart, Area Chart etc.)
A Head & Shoulders pattern is an indication of a trend reversal and when formed in an upward trend it means a downward trend is coming.
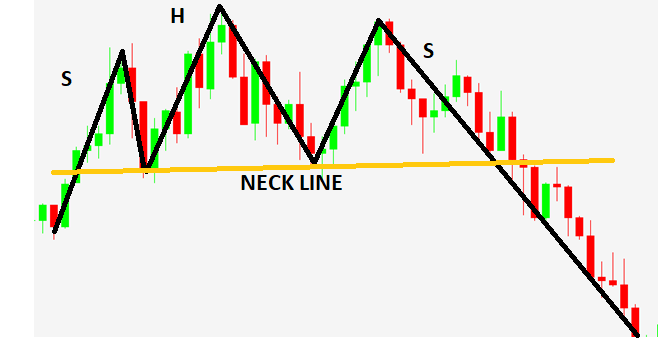
The Head (H) is always the tallest of the three peaks while both shoulders (S) may be roughly same height. The Neck is a common support line where the Head & two shoulders must sit on.
The Neck must not be a straight line as it can slant but the important thing is that the Head & shoulders must sit or rest on the Neck.
When price breaks through the neck line, its an indication to sell and you could place your stop loss near the right shoulder.
Head & Shoulders Appears Inverted in a Down Trend
When formed in a downward trend, the Head & Shoulders pattern forms upside down
The attributes remain the same but it forms below the Neck line & not above it.
A head & Shoulders pattern that forms in a downward trend indicates that an upward trend is coming
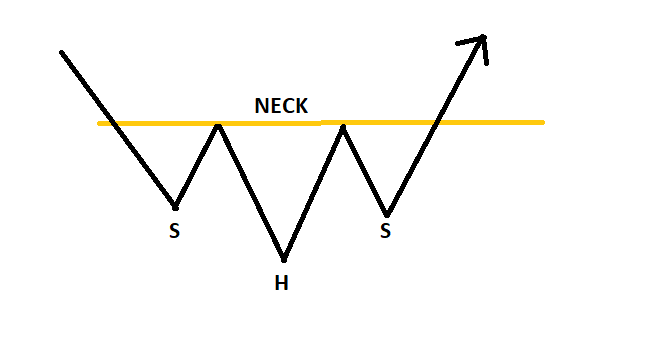
When formed in a downward trend, the Head & Shoulders pattern forms upside down
The attributes remain the same but it forms below the Neck line & not above it.
A head & Shoulders pattern that forms in a downward trend indicates that an upward trend is coming
When you spot an inverted Head & Shoulder pattern in a down trend, you can place a buy order while setting your stop loss below the neck(near the shoulder).
Double Top Pattern
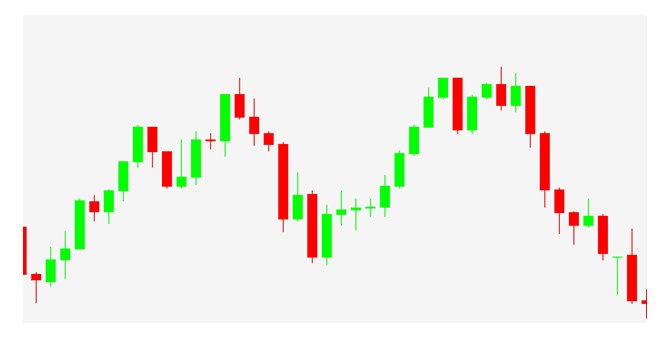
The Doube Top Pattern forms in an upward trend only and it usually indicated a trend reversal. So, when spotted in an upward trend, expect a reversal to a downward trend
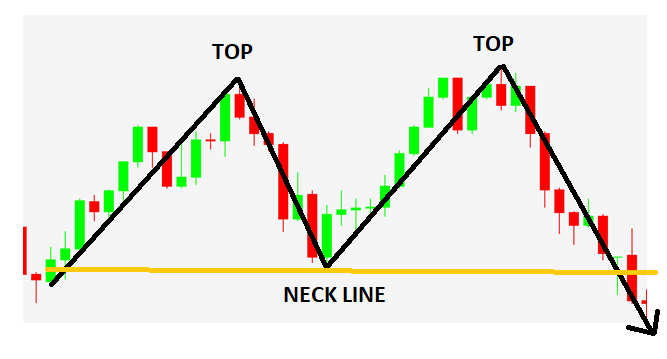
A Double Top chart pattern is made up of two peaks/tops that reach almost the same height and both sit on the same horizontal neck line
When price breaks through the neckline, it is an indication to sell or short the market while setting your stop loss above the neckline close to the top/peak
A Double Top Appears Inverted in a Down Trend (Double Bottom)
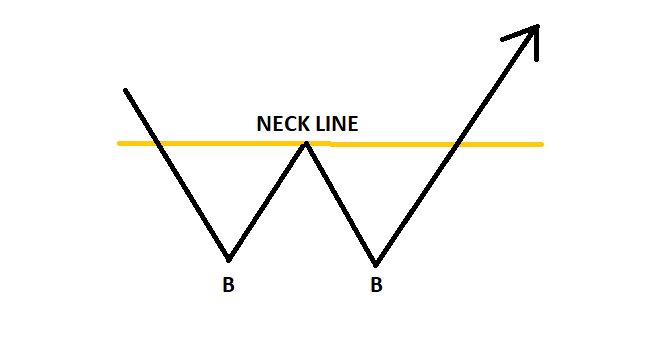
A Double Bottom only forms in a downward trend & is the reverse/inverse of a Double Top pattern and it forms below the neck line.
When you spot a Double Bottom it means a reversal to an upward trend is imminent so you can place a buy order & place your stop loss below the neck line.
Cup & Handle Pattern
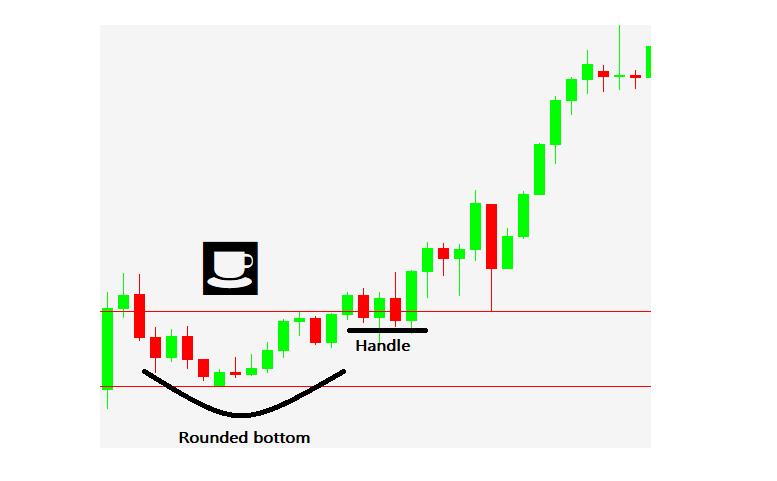
The Cup & Handle pattern appears in a downward trend only & when its spotted it means a reversal to an upward trend is imminent.
The Cup & Handle Pattern looks like a teacup & has a rounded bottom, with a horizontal handle.
Symmetrical Triangle Pattern
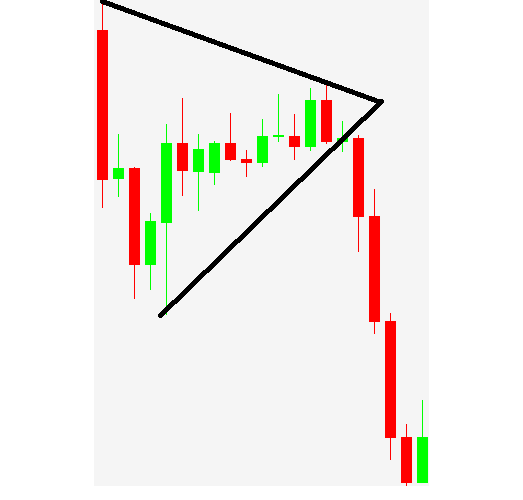
Sometimes an ongoing trend can pause and start moving sideways and you get confused as to whether the trend will continue. This is where the triangle patterns come in handy.
Triangle patterns are usually a sign of trend continuation and they show you that the primary trend will still continue after moving sideways.
The Symmetrical Triangle is one of such triangle patterns & it can form in either an upward or downward trend.
To identify a Symmetric Triangle Pattern, you draw a line connecting the highest price reached at the pause of the trend with the highest price reached during the sideways trend or retracement.
You also draw a line connecting the lowest price reached during the sideways trend or retracement, to the other line you drew and this forma a triangle.
The takeaway here is that when you spot a symmetric triangle during a trend, the chances are high that the trend (upward or downward) is going to continue.

Leave a Reply