Click on the Currency Pair
You need to select the currency pair whose chart you want to view & when you do that the chart will appear on your screen.
The price is always on the vertical axis while the date and time is at the bottom of the chart.
Select chart type
You can select the type of chart you want to read by clicking on the chart icon in the toolbar. Candlestick Charts are ideal for picking entry & exit points, Line & Area Charts are ideal for comparing different currency pairs, etc.
Select the Timeframe
For charts that are based on time (such as candlestick chart), the timeframe is the frequency at which new candles form on the charts.
If you select a 5 Minute timeframe, expect new candles or bars to be formed every 5 minutes.
Candles hold price memory so this means for a 5-minute timeframe, every candle will contain price information for the last 5 minutes.
If you select the 1 Day timeframe, then a new candle will completely form after 1 Day, & each candle will show price information for 1 day & so forth.
If you don’t intend to spend much time on a trade, meaning you hope to get in & out quickly, you can trade with the minute timeframes because they form faster.
However, even when using minute timeframes always consult higher timeframes to see the overall trend/direction of the market & use smaller minute timeframes to pick your entry/exit levels.
For example, a 5-minute timeframe may show you the market is in an uptrend but when you switch to a 4-hour time frame, you realize the market is only in a temporary retracement within a downtrend.
Pick Your Selection Tool
To be able to read prices on a forex chart with precision, you need a selection tool such as the Crosshair & Arrow
The Crosshair Tool
The crosshair selection tool is a multifunctional tool shaped like a cross. It can be used to compare prices on the chart, to the reading of a technical indicator under the chart.
Crosshairs can also be used to precisely read price information on a chart.
You can place your cross-hair tool anywhere and it will point you in the direction of the price (on the right) & date of transaction (at the bottom).
The Arrow Tool
The cursor is shaped like an arrow & has less precision than the cross hair. You can also use the cursor to locate the price on a forex chart.
Simply point the cursor at a candle and the OHLC price information will be displayed for you to see.
You can also use the cursor to drag left to see past data & drag right to see more recent data.
Locate the Buy & Sell Price on the Forex Chart
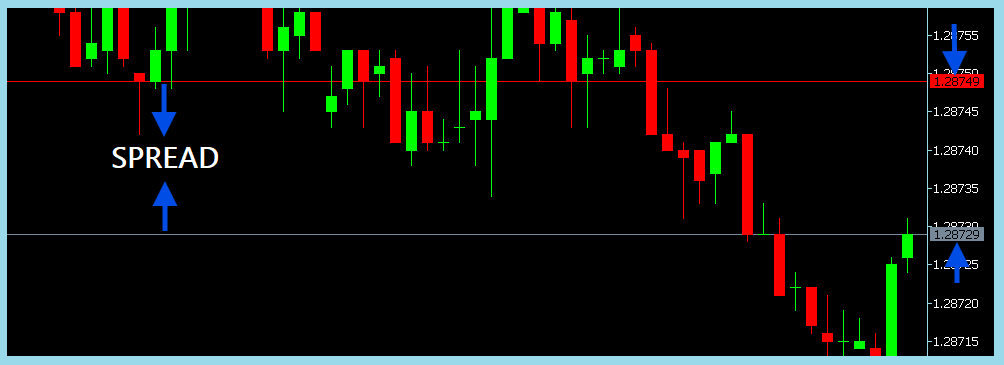
On a forex chart, the Buy & Sell prices are always shown by two horizontal lines with different colors that extend from the vertical scale/price axis.

The upper line represents the Buy Price which you are expected to pay if you want to enter a long trade.
The lower line represents the Sell Price, which is what you will pay to open a short trade.
The gap between the Buy/Sell lines represents the spread & the gap is wider when spread increases and narrower when spread tightens.
The gap between the Buy/Sell lines gives you a visual representation of how wide or tight the spread for a currency pair is.

Leave a Reply