What is RSI in Forex?
Relative Strength Index (RSI) is a technical indicator that shows you when an instrument is overbought & when it is oversold. You can use this information to detect a trend early & ride it to profitability.
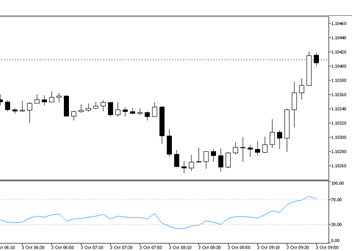
The RSI indicator appears under your chart and for precise reading, you should use the crosshair tool to connect the points on the main chart, to points on the RSI indicator chart.
Which RSI is Bullish?
When the RSI reading is below 30 it means the instrument is oversold & its price could start rising so you could prepare to open a buy trade to benefit from the rise.
Which RSI is Bearish?
When the RSI reading is above 70 it means the instrument is overbought & its price could start falling so you could enter a sell trade to benefit from the fall.
RSI Limitations
The limitation of RSI is that since it depends on past data, (and there’s no standard deviation) the data may not be 100% accurate.
The RSI indicator is set to a default period of 14 but you can change this. If you chart is on a daily timeframe, the 14 will mean 14 day (the indicator will calculate strength for the past 14 days).
You should use the RSI indicator alongside other indicators such as Bollinger Bands for confirmation.
How To Setup a Forex Trade with the RSI Indicator

From the screenshot above you will notice the RSI indicator reading is above 70. This means the instrument being traded is overbought.
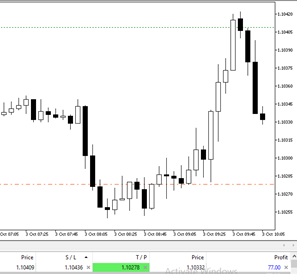
Price in an overbought market will soon start to fall so we place a short trade (green line indicates where the short trade was placed).

As expected, the price begins to fall and the short trade becomes profitable. The RSI indicator is available of MT4 & MT5 platforms.
How to Delete RSI Indicator
To delete the RSI indicator, right click on the RSI curve and select delete.

Leave a Reply