A Simple Moving Average (SMA) helps you confirm the direction of an existing trend as per your current timeframe, which is extremely important because you don’t want to trade against the primary trend.
If the price is moving above the SMA, then the market is in an uptrend. If price is moving under/below the SMA line, the market is in a downtrend. The farther the price moves from the SMA line, the more potent the trend is.
The SMA indicator when selected manifests as a curvy line overlaid on your existing chart & it can also act as a support & resistance level on charts.
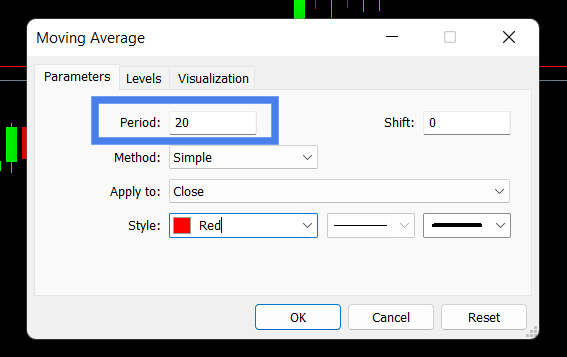
Simple Moving Average Setup: When you call up an SMA indicator, a dialogue box will pop up for you to specify the period whose prices are to be averaged.

If your chart is already set to a 1-day timeframe & you select a period of 20, then you’re basically going to get a 20-day moving average line.
The SMA line that will form will represent the average closing price of the instrument from day 1 till day 20.
The higher the period selected, the smoother the SMA line will be & although 20 is the default period you can change it to any period you want.
You can also pick which of the prices will be averaged such as the open, high, low, or close price etc. but the close price is the default setting.
Simple Moving Average Strategy:
When price climbs above an SMA line, you can place a buy trade because it means the instrument price is higher than it has been in the last 20 days (about 3 weeks).
When price falls through an SMA line, it may be time to sell because it means the price is lower than it has been in the last 20 days etc.
The drawback of the Simple Moving Average indicator is that it does not react quickly to live changes in price & this is known as lag.
By default, the SMA period is set to 20 but if you increase this figure, you will notice more lack of synchronization & lag in the way the SMA line forms. This is why it is referred to as a lagging indicator.

Leave a Reply