CPI stands for Consumer Price Index and is an indicator of whether the inflation in an economy is rising or falling.
As a trader, you want to keep an eye the United States CPI report released every month by the US Bureau of Labour Statistics https://www.bls.gov/cpi/
Why? Because the US Dollar is the most traded currency in the world, & when inflation/CPI increases the US Dollar weakens & vice versa.
In response the US Federal Reserve (US Central Bank) could increase interest rates to fight high CPI/inflation or decrease interest rates to fight low CPI/inflation.
Other key CPI data to watch out for are the CPI for the United Kingdom, CPI for the European Union & CPI for Japan.
Where can I Find the US CPI Report?

The United States Monthly CPI Report is usually published on the US Bureau of Labour Statistics website https://www.bls.gov/cpi/ at the beginning of every month.
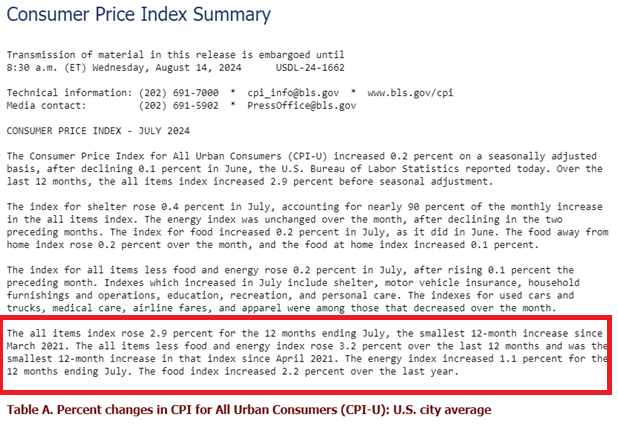
You can download the report in PDF format but above is a sample of the CPI Report for July 2024.
When studying the CPI report, you will see CPI for other sub-categories but what we are interested in is the “CPI for All Items Index” because it’s a summation of all the other sub-categories.
From the above image we can see that the US All Index CPI for July 2024, was 2.9% YOY.
What is the Acceptable Inflation/CPI Figure for a Healthy Economy?
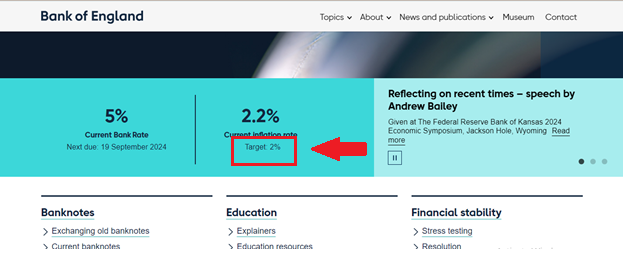
Ideally 2% is the ideal inflation/CPI rate for any healthy economy. All Central Banks always set 2% as their target inflation/CPI rate.
If Inflation/CPI is below 2% it means the economy is suffering deflation & is slowing down.
Why is Deflation bad? Well, during a period of deflation, people refuse to spend money because they are expecting prices to keep falling.
Deflation causes the economy to slow because people are holding onto their money and looking for cheap products since they expect prices to fall.
On the flip side, when inflation is above 2% the economy also starts to slow down because people stop spending money since prices of goods are too high.
The solution? Keep inflation at an acceptable level of 2% & that’s one of the core responsibilities pf any Central Bank.
How to Trade Using CPI
- Check The Release Calendar
- Compare the latest CPI to the previous one
- Compare the latest CPI to the forecasted figure
- Compare the latest CPI to the Central Banks intended Target
Check The Release Calendar

You cannot trade CPI if you don’t know when the report will come out.
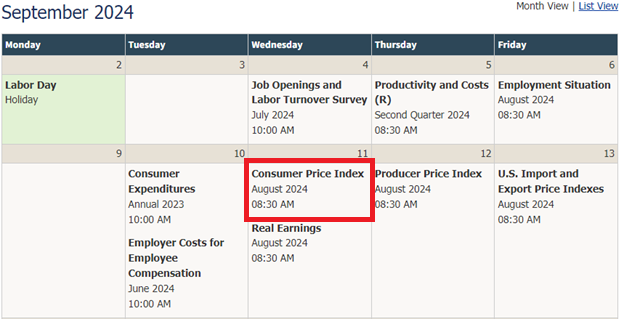
For the United States CPI, you can check the release calendar on the website of the US Bureau of Labor Statistics https://www.bls.gov/schedule/2024/09_sched.htm
This will give you an idea of when the data is coming out so you can develop your trading strategy in advance.
Compare the Latest CPI to the Previous One
When new CPI data is released every month, you can compare it to that of the previous month to know if it has increased or decreased.
An increase in CPI above the 2% health range implies an increase in inflation which means the issuing country may increase interest rates to fight inflation.
If rates are increased the currency becomes stronger (this applies to healthy economies only) as more investors invest in the economy.
Example 1: CPI Increases above 2%
If the EUR/USD is trading around 1.0046 & US CPI data is released showing inflation is on the rise above the acceptable 2% range, the US Federal Reserve may increase interest rates.
The hope/anticipation of rate increases will attract investors to the US Dollar thus strengthening the dollar which means it will cost less US Dollars to buy 1 Euro.
This will cause EUR/USD to start trading at a lower price range than the current 1.0046 so you can open a short trade to benefit from the drop in price.
Example 2: CPI Falls to/near the 2% Range
When CPI data is released and it shows inflation is falling & nearing the healthy 2% range, a Central bank of the issuing country may cut interest rates
The fear/anticipation of rate cuts will make investors begin to pull out from the US Dollar thus weakening it so it will cost more US Dollar to buy 1 Euro.
If EUR/USD was trading at say 1.0046 before the US CPI data showing slowing inflation was released, it could start trading at a higher range so you can open a long trade to benefit from the rise,
Compare the latest CPI to the forecasted figure
A forecast is simply where most experts on the economy predict inflation will go. When you listen to business news & economic analysis you get an idea of what the public is thinking.
When CPI data is released every month you must compare it to the forecasted figure to see if it’s at par.
If the latest CPI release looks better than forecasts it’s a good sign
However, if the latest CPI release looks worse than the forecasts then it’s a bad sign
Example: CPI Data Looks Better than Forecast
US inflation is currently at 5%, and experts forecast a drop to 3%, then CPI comes out showing a drop to 2%
This means CPI looks better than analysts had forecasted.
Of course cooling inflation will means Central Banks will cut interest rates but the fact that it’s actually lower than forecasted means the markets will react more boldly.
The anticipation of rate cuts will make investors move away from the US Dollar so if you’re trading EUR/USD the price will rise.
You can open a long trade to take advantage of the rise in EUR/ISD price.
Example: CPI Data Looks Worse than Forecast
US inflation is currently at 5%, and experts forecast a drop to 4%, but CPI comes out showing a rise to 6%
In this case the CPI looks worse than predicted because the CPI figure is higher than what experts predicted.
Rising inflation will mean Central Banks may increase rates so the anticipation of rate hikes will make investors troop t the dollar and its value will increase.
If you were trading a pair like EUR/USD, the price will fall (since it will cost less USD to buy 1 Euro) so you can open a short trade to benefit from a bearish market.
Compare the latest CPI to the Central Banks Intended Target

Every Central Bank always has an inflation target meaning where they want their inflation rate to be.
Whenever CPI data is released, you can compare it to the Central Bank’s target rate to see if it is nearing the target.
If CPI data shows inflation is nearing the target, the Central Bank could start cutting rates (even if inflation hasn’t gotten to the target)
Example: CPI shows inflation is nearing target
If the US Federal Reserve target inflation rate is 2%, and the latest monthly CPI data shows inflation fell to 2.6%. The Fed may choose to start cutting rates.
Anticipation of rate cuts will mean an outflow of investments from the US & the Dollar weakens so EUR/USD price will go up. So you can open a long trade during this period.
Example: CPI shows inflation is still far from target
If the US Federal Reserve target inflation rate is 2%, and the latest monthly CPI data shows inflation fell from 7% to 6.5%. It is likely the fed will not cut rates.
The anticipation of no rate cuts or even higher rates will affect the market as investors will not run away from the dollar. They will leave their investments in the dollar because they don’t expect interest rates to be reduced.
If you were trading EUR/USD then you could expect the price to remain at the same range.

Leave a Reply