Price action trading is trading in its rawest form with no sort of “filters” such as technical indicators.
Price action trading is just looking at the naked charts and looking for patterns while using basic tools like trend drawing lines.
You should not just depend on filters such as technical indicators because those indicators were built by people who understand price action. You should strive to understand why price behaves the way it does.
So imagine for a moment that you didn’t have any filters at your disposal, and all you had was a chart in front of you, are you going to be able to make sense of the charts?
We will discuss important tips to help you make sense of price charts even without any filters or help from other sources. This is what price action trading is about.
#1. Treat Trading Sessions as Ranges
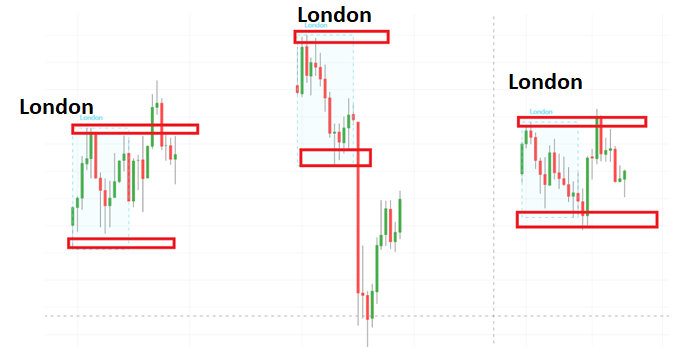
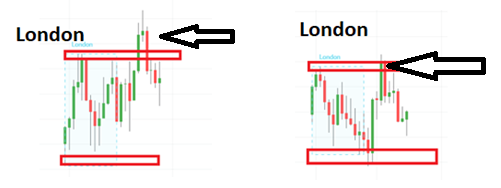
When trading forex you could mark each trading session with a support line at the lowest price wick recorded during the session, & a resistance line at the highest price wick recorded.
Alternatively you could mark the resistance/support levels as ranges to leave room for error.
Doing this enables you to monitor how price levels change from one session to another.
From our knowledge of resistance/support lines (discussed earlier in this module) we know that when price falls below a support line, the chances are it could start trading at a new/lower level. Let us look at some examples:
Example 1
For instance, when the Asian session ends and the London session begins, you could notice that price could fall through the support line you drew for the Asian session. This could mean the London session will start trading at a lower level than the Asian session so you could open a short trade.
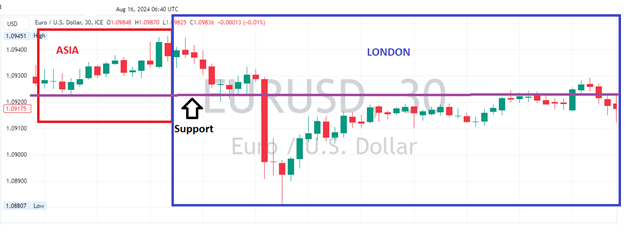
Example 2
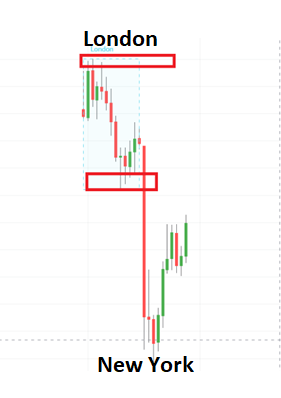
For another example at the end of the London session the price could also fall past the support line drawn for the London session. This will mean the incoming New York session could start trading at a lower level hence you could also place a short order. See image below:
Example 3
On the flip side, price could also break through the resistance line you drew for the Asian session meaning the incoming London session could start trading at a higher level. For this, you could open a long trade to benefit from the upward movement.
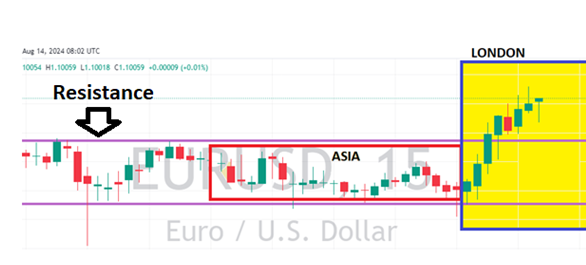
Example 4
Sometimes after one session is over and the next one begins, you could notice price testing the support/resistance line you drew for the previous session.
Sometimes, price is unable to break through the support/resistance and continues trading within the range. This is called a false breakout and is commonly seen during the Frankfurt session.
#2. Look Out For Big Candlesticks With Little/No Wicks
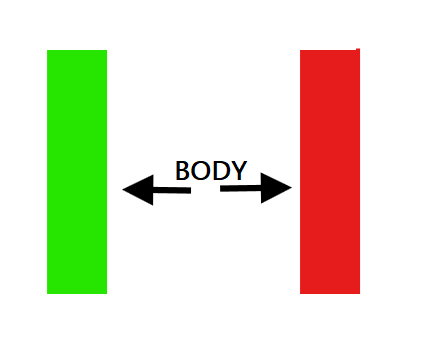
A candle with no wick basically tells you that the price at which that candle opened, is a potential area of value so you should mark that price by drawing a support/resistance line.
The chances are high that price will keep bouncing off the support/resistance line.
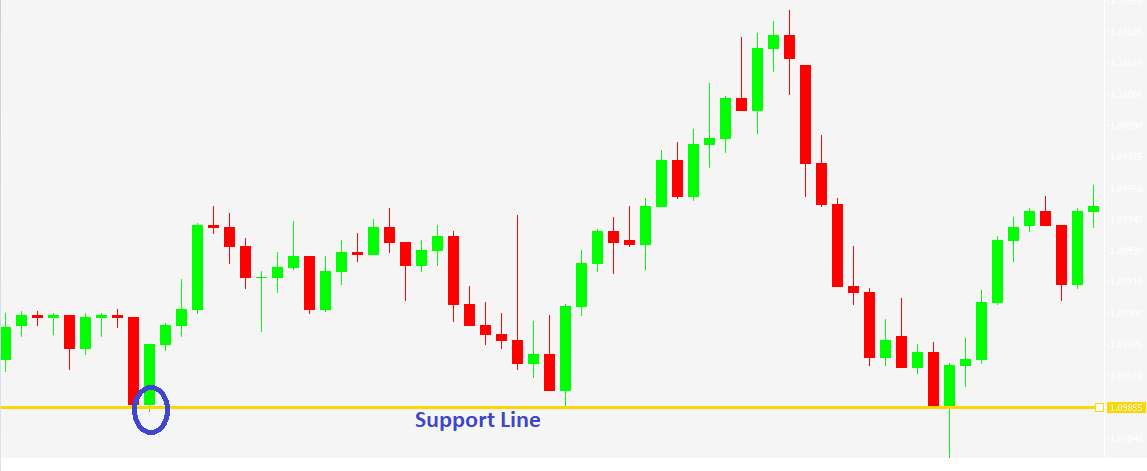
In the image above, a big green candle with no wick is identified and marked with a blue circle. A yellow support line is drawn to mark the support level, & after that you will notice price is bouncing off that support line.
When you see a big red candle with little or no wick like we have in the image below, you can draw your resistance/sup[port line at the top of the candle where the opening price usually is.
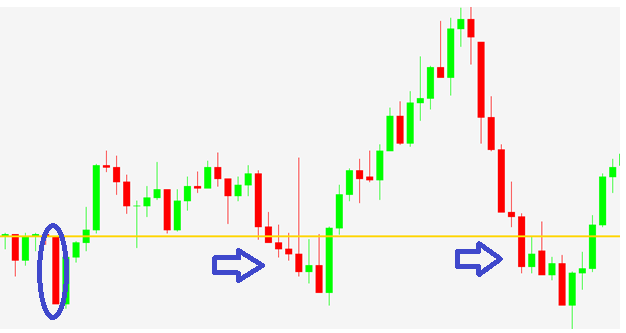
You will notice that when price tests the line, it bounces off and when price falls past the line the downward trend continues.
#3. Little Pullbacks Don’t Nullify a Trend
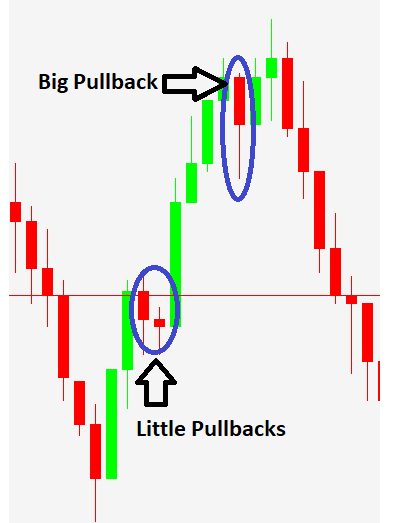
Price action traders should trade the direction of major trends, and learn not to be spooked by little sized pullbacks.
After little pullbacks, the trend will always continue but after big pullbacks the trend may end. This is because big pullbacks mean more traders are exiting the market which can crash the price.
In an upward trend, pullbacks will always show up because some buyers are exiting with their profits, but this does not nullify the uptrend.
In a downtrend pullbacks will also occur because some sellers will exit with their profits, but the trend will likely continue.
However, if the pullbacks show up in the form of big candles, then it may be a sign that the trend is about to reverse.
#4. Use Candlestick Patterns To Predict Trend Beginnings/Reversals
There are several candlestick patterns out there, and knowledge of them will help you predict when a trend is about to start or end.
Technical indicators are mostly lagging so they show you signals with a delay or lag. By the time they show you a trend is starting, the delay will cause you to miss out on the early parts of the trend.
However, when you understand how to read candlestick patterns, you can detect a trend reversal even before it happens.
In the next chapter, we are going to discuss candlestick patterns in detail.
#5. Don’t Place Your Stop Loss At Predictable Levels
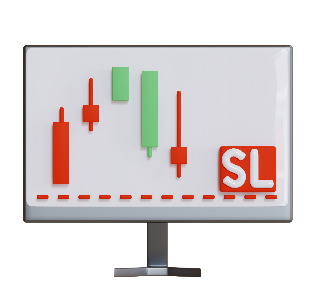
Most beginner traders will always place their Stop Loss (SL) a few pips away from their entry price, & this is very predictable.
The professional traders can guess where beginners have placed their SL, so they simply place their entry at that same level. This forces price to move towards your SL so as to generate liquidity for the professional traders.
Since price action trading doesn’t involve the use of indicators, you must manage risk better by not engaging in predictable trading behavior.

Leave a Reply