What is Resistance in Forex?

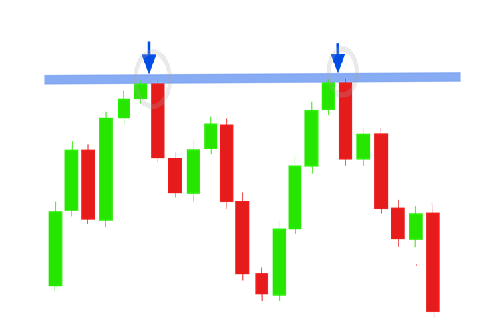
Resistance is a highpoint on a chart where upward trends are subdued & they reverse course to a downward direction.
A resistance level acts like an invisible ceiling and upward price movements have trouble breaking through it.
With your resistance level found, the chances are high that the next time an upward trend hits that level, it is going to change into a downward trend.
However, if an upward trend gathers enough momentum to break through the resistance ceiling, chances are that the trend is going to sustain its upward momentum for a while.
What is Support in Forex?

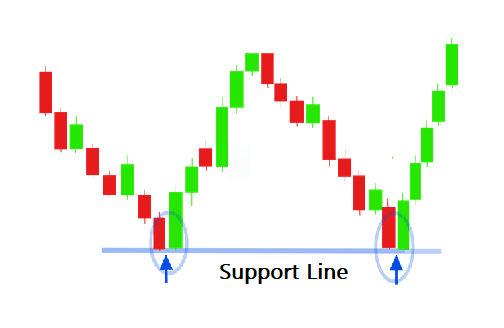
Support is like an invisible floor on a chart & when a downward trend hits a support level, it reverses course into an upward trend.
When you draw your support level, the chances are that next time a downward trend hits it, it will turn into an upward trend.
However, if the downward trend is strong enough to overcome the support floor & break through it, the chances of the trend continuing in its downward momentum is high.
Which Tool Do I Use To Mark Support & Resistance Lines in Forex?

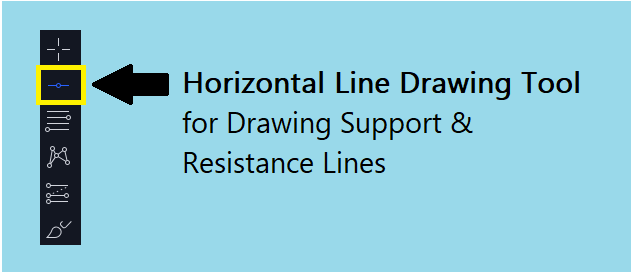
The Horizontal Line Tool is used for drawing support & resistance lines on a forex chart.
When you detect a support/resistance level on a chart, you should mark it by drawing a horizontal line and this can be easily done using the horizontal line drawing tool.
To draw a support/resistance line, click on the “Draw Horizontal Line” tool, then click on the target point; & the line will appear.
To delete a support or resistance line, right click on the line & then click on delete.
The horizontal line drawing tool can be found in your toolbar and should not be confused with the trend line tool which is meant for trend line drawing.
When you draw support & resistance lines using the horizontal line drawing tool, the line can be seen in any timeframe.
So, if you drew the line on a 1-hour timeframe, you could switch to a 5-minute timeframe & the line will still be visible.
Drawing a support/resistance line correctly is important because the line shows you the price associated with the support or resistance.
Using that price, you can open a pending order to be automatically executed in advance when price touches the support/resistance line.
Support/Resistance Lines Could be Breached Slightly

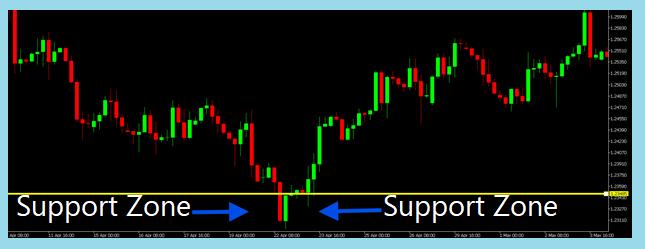
Sometimes price could test your support/resistance line and exceed it by some inches, before it loses momentum and reverses course in the opposite direction.
So, you may want to wait to be sure that the breakout is authentic before you execute a trade.
To give room for this error, you should treat the area around support/resistance lines as a “zone of support/resistance”.
If price reverses around the zone, then it is still valid.
Some Support/Resistance Levels Are More Credible Than Others
The more price has tested a support/resistance level in the past without breaching it, the more credible it is.
You need to check the chart to see how many times the support/resistance has been tested as this will tell you if you should rely on it or not.
To check the creditability of a support/resistance line on a chart, switch to a higher timeframe. Any support/resistance line your discover on a higher timeframe is more credible than those on lower timeframes.
Support Can Become Resistance & Resistance Can Become Support

If a downward trend breaks through a support line, & then tries unsuccessfully to reverse into an upward trend, then the support line has automatically become a resistance line.

Leave a Reply